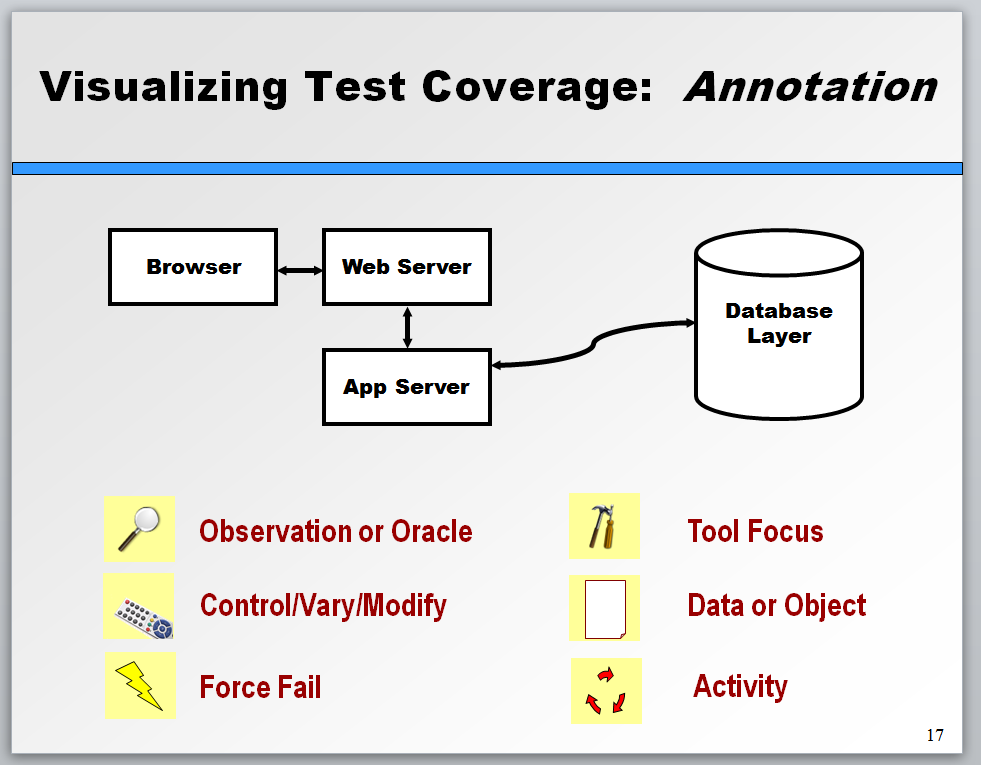
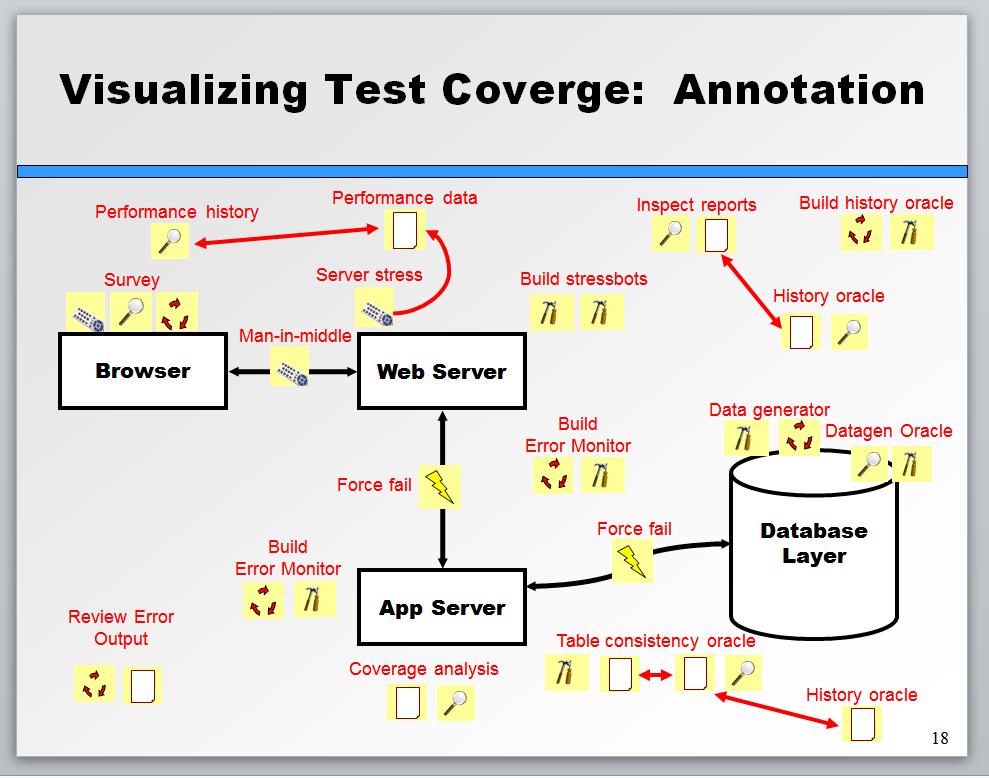
Over the last few years, people have become increasingly enthusiastic about the idea of mind mapping to help them describe or illustrate or otherwise consider test coverage. For me, Darren McMillan was the one who really got the ball rolling here, here, and here. More recently there have been other examples to present coverage ideas. Colleague Adam Goucher has weighed in here. But there’s another thing you can do, something that James Bach and I have been talking about in the Rapid Software Testing class for a couple of years now: You can use a mind map to help decide about how might allocate your time when you’re dealing with an uncertain situation. You can do this with a functional or structural diagram, too. Let’s try this with an example.
- There is a given number of hours in a typical week; let’s say 40.
- There are some testers on the team; let’s say four.
- Each tester can accomplish a certain amount of uninterrupted testing time in the course of a day. For this exercise, let’s say that it’s three 90-minute sessions per tester per day. That means that each tester could accomplish 15 sessions per week, so our team of four could pull off 60 sessions per week.
Now, most sessions are not entirely productive in terms of test coverage. That is, sessions are not typically dedicated entirely to on-charter test design and execution (that’s called that testing time or T time in session-based test management). T-time is regularly interrupted by other activities. Apart from test-design and execution, whereby we obtain test coverage, there’s usually some setup time (S-time), and there’s almost always some bug investigation and reporting time (B-time). We can’t predict how well any given session is going to go, but over time we can learn to develop a sort of first-order, back-of-the-envelope, finger-in-the-air, heuristic, probably-wrong-but-right-enough kind of guess. We are talking about predicting the future, here. Let’s say that between them, our general experience with this development group is that B-time and S-time tend to cost us about a third of our time as we’re testing.
So, in order to figure out how we’re going to spend our time this week, we can’t say that we’re going to get 60 sessions worth of test coverage. Our effective testing time is more like 40 idealized sessions. Let’s represent those sessions with sticky notes—one perfectly session per note. For the team we’re imagining here, we’d have 40 sticky notes to work with.
Different sessions usually have different themes—tasks, activities, or approaches. As we engage with a brand-new feature, we might perform an “intake” or “survey” or “reconnaissance” session, with the goal of identifying what’s there to be tested. “Analysis” sessions might help us to decide on where certain risks are, what we want to cover, or how we want to cover it. As we get deeper into the testing of a particular feature (“deep coverage” sessions), we might want a given session to be focused on a particular kind of test coverage—straightforward capability testing, data- or domain-focused testing, or testing on a specific platform. Maybe we want to cover a feature of the product while focusing on a particular parafunctional quality criterion, like performance or usability. Perhaps we want to allocate some sessions to design or coding of test oracles. Maybe we could dedicate a session or two to exploring the product based on problem reports from the help desk. If we’d like to highlight specific dimensions of activities or coverage, we can decorate our sticky notes with icons, one or two key words, or a dot——or we can use different colours for the notes, or some combination of these things. In this example, we’ll use little icons to represent classes of activities.
Now get the team together in front of a whiteboard or flip chart to look at your structural diagram, flowchart, or mind map. Place a sticky note (perhaps with a few words of explanatory text) on each node (functional area) or line (interface) on the map you’d like to cover with an idealized session. Keep putting sticky notes on the diagram until you’ve used them up.
By the time you’re out of sticky notes, you will have begun to develop some ideas about what you might or might not be able to accomplish given a week to do it. Are some areas not covered at all? Pick up a sticky note from somewhere else, and move it around. Should certain risky or complex areas receive more attention than others? If so, they might be worthy of more nodes and more than one sticky note. Not enough sticky notes—that is, not enough time, given the people you have available—to cover the whole diagram as well as you’d like? In that case, something has to change, but if all the assumptions above still hold, the catch is that you only have 40 sticky notes to work with and to redeploy.
There’s another catch, too. Diagrams are models. Models are simplifications of reality, and so they leave stuff out. In this kind of exercise, things that don’t appear on your diagrams can be easy to forget. Some essential aspects of test coverage might not fit very well on the diagram, or indeed on any diagram. As you notice missing items or missing ideas, put them on the diagram or on a list in one corner of the space. Keep asking what might be missing from the diagram or the list. Each element on the list is a potential candidate for its own sticky note—or maybe you can cover two or three list items within a single session.
Once the diagram has been covered with general ideas, we can choose to write a more specific and refined charter for each sticky note.
Maybe our sessions won’t be as productive as we thought. If, in the course of testing, we determine that our assumptions aren’t meshing well with reality, we can revisit the diagram and the sticky notes to re-evaluate as soon as we have any information that might threaten the schedule or the anticipated test coverage. We’d typically look at a new diagram, or look at an old diagram in a very different way, every week or two in any case.
This approach could be adapted to mesh very well with the ideas that Paul Holland outlines in this article.
Making things visible provides a point of departure for conversations about strategy, logistics, and timing. It’s important for us to have the skill of telling a story about what there is to test, how we could test it, what we could cover, and what our constraints might be. Some simple visual aids can help us to illustrate that story.


[…] Blog: Time, Coverage, and Maps Written by: Michael Bolton […]
I actually started a blog around this, but not specific to the tracking time aspect. It was about your mind mapping talk you’d presented at EuroStar 2011 in the test lab.
I never did get to finish it, but you’d touched on using mind maps to plan out testing sessions, so it’s very good to see you expanding on those thoughts here.
Hopefully we’ll get a chance to meet up again soon, I’d love to show you some of the things I’ve been doing with them.
[…] Michael Bolton’s mind-maps […]