Once upon time, in a high-tech business park far, far away, there were four companies, each working on a development project.
In Project Blue, the testers created a suite of 250 test cases, based on 50 use cases, before development started. These cases remained static throughout the project. Each week saw incremental improvement in the product, although things got a little stuck towards the end. Project Blue kept a table of passing vs. failing test cases, which they updated each week.
| Date | Passed | Failed | Total |
|---|---|---|---|
| 01-Feb | 25 | 225 | 250 |
| 08-Feb | 125 | 125 | 250 |
| 15-Feb | 175 | 75 | 250 |
| 22-Feb | 200 | 50 | 250 |
| 29-Feb | 225 | 25 | 250 |
| 07-Mar | 225 | 25 | 250 |
In Project Red, testers constructed a suite of 10 comprehensive scenarios. The testers refined these scenarios as development progressed. In the last week of the project, a change in one of the modules broke several elements in scenario that had worked in the first two weeks. One of Project Red’s KPIs was a weekly increase in the Passing Scenarios Ratio.
| Date | Passed | Failed | Total |
|---|---|---|---|
| 01-Feb | 1 | 9 | 10 |
| 08-Feb | 5 | 5 | 10 |
| 15-Feb | 5 | 3 | 10 |
| 22-Feb | 8 | 2 | 10 |
| 29-Feb | 9 | 1 | 10 |
| 07-Mar | 9 | 1 | 10 |
Project Green used an incremental strategy to design and refine a suite of test cases. Management added more testers to the project each week. As the project went on, the testers also recruited end users to assist with test design and execution. At the end of four weeks, the team’s Quality Progress Table looked like this:
| Date | Passed | Failed | Total |
|---|---|---|---|
| 01-Feb | 1 | 9 | 10 |
| 08-Feb | 25 | 25 | 50 |
| 15-Feb | 70 | 30 | 100 |
| 22-Feb | 160 | 40 | 200 |
In Week 5 of Project Green, the managers called a monster triage session that led to the deferral of dozens of Severity 2, 3, and 4 bugs. Nine showstopper bugs remained. In order to focus on the most important problems, management decreed that only the showstoppers would be fixed and tested in the last week. And so, in Week 6 of Project Green, the programmers worked on only the showstopper bugs. The fixes were tested using 30 test cases. Testing revealed that six showstoppers were gone, and three persisted. All the deferred Severity 2, 3, and 4 bugs remained in the product, but to avoid confusion, they no longer appeared on the Quality Progress Table.
| Date | Passed | Failed | Total |
|---|---|---|---|
| 01-Feb | 1 | 9 | 10 |
| 08-Feb | 25 | 25 | 50 |
| 15-Feb | 70 | 30 | 100 |
| 22-Feb | 160 | 40 | 200 |
| 29-Feb | 450 | 50 | 500 |
| 07-Mar | 27 | 3 | 30 |
In the first few weeks of Project Purple, testers worked interactively with the product to test the business rules, while a team of automation specialists attempted to create a framework that would exercise the product under load and stress conditions. At the end of Week Four, the Pass Rate Dashboard looked like this:
| Date | Passed | Failed | Total |
|---|---|---|---|
| 01-Feb | 1 | 9 | 10 |
| 08-Feb | 25 | 25 | 50 |
| 15-Feb | 70 | 30 | 100 |
| 22-Feb | 80 | 20 | 100 |
In Week 5 of Project Purple, the automation framework was finally ready. 820 performance scenario tests were run that revealed 80 new bugs, all related to scalability problems. In addition, none of the bugs opened in Week 4 were fixed; two key programmers were sick. So at the end of Week 5, this was the picture from the Pass Rate Dashboard:
| Date | Passed | Failed | Total |
|---|---|---|---|
| 01-Feb | 1 | 9 | 10 |
| 08-Feb | 25 | 25 | 50 |
| 15-Feb | 70 | 30 | 100 |
| 22-Feb | 80 | 20 | 100 |
| 29-Feb | 900 | 100 | 1000 |
In Week 6 of Project Purple, the programmers heroically fixed 40 bugs. But that week, a tester discovered a bug in the automation framework. When that bug was fixed, the framework revealed 40 entirely new bugs. And they’re bad; the programmers report most of them will take at least three weeks to fix. Here’s the Pass Rate Dashboard at the end of Week 6:
| Date | Passed | Failed | Total |
|---|---|---|---|
| 01-Feb | 1 | 9 | 10 |
| 08-Feb | 25 | 25 | 50 |
| 15-Feb | 70 | 30 | 100 |
| 22-Feb | 80 | 20 | 100 |
| 29-Feb | 900 | 100 | 1000 |
| 07-Mar | 900 | 100 | 1000 |
Here’s the chart that plots the percentage of passing test cases, per week, for all four projects.
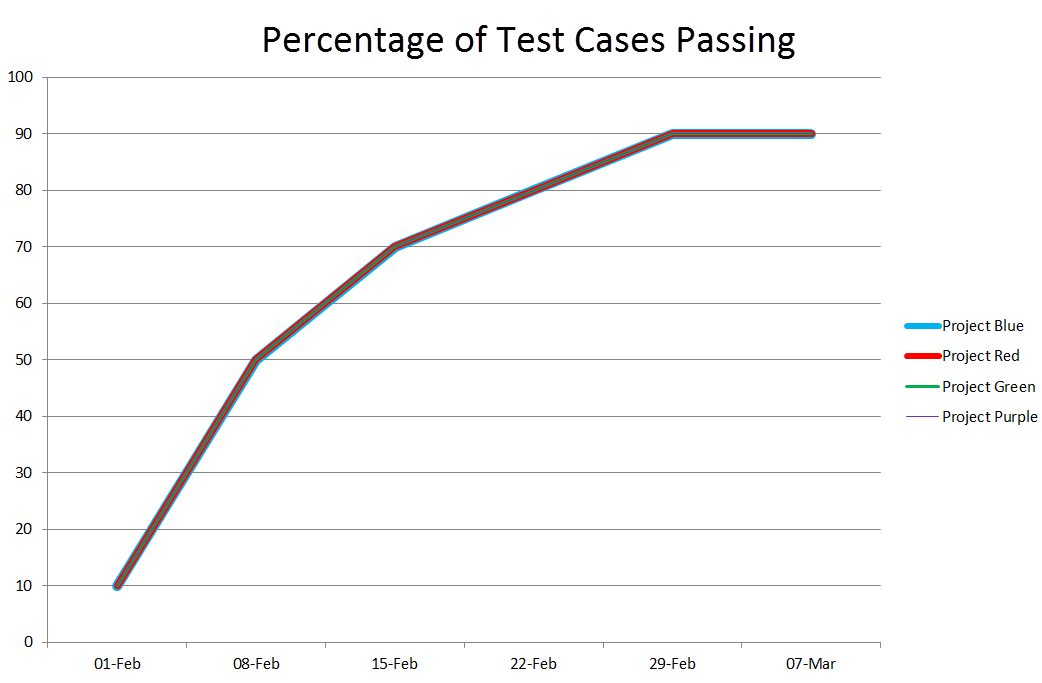
Four entirely different projects.
As usual, James Bach contributed to this article.
So is the take-away lesson that it is not so important what you are doing – the passing test cases ration will exponentially reach 100% like a good charging capacitor in all cases – but that you have to do *something*?
Michael replies: People are welcome to take away whatever lessons they like. I was intending to show that the pass-fail ratio is a pretty unhelpful way to look at the state of the product unless you know the story behind the numbers—and if you know the story, the numbers have little relevance.
Oh… and one more thing: the ratio of passing test cases to test cases performed or to failing test cases is particularly bogus to me. “Test case” is not a valid measurement unit; one test case is not commensurable with another; a test is a complex cognitive procedure (or maybe it isn’t); a “passing” test case is one kind of information, and “failing” case quite another. If a count isn’t meaningful, a ratio of two meaningless counts is even less meaningful.
These stories play counter to:
http://www.ministryoftesting.com/2014/04/daily-defect-count-image-camel/
http://www.ministryoftesting.com/2011/07/a-little-track-history-that-goes-a-long-way/
and that’s OK :). I would be the first to do the “We can construct a context, where this is true” argument. 🙂
Tracking testcases is a tool, that in some contexts can aid answering managements question: “How are we doing” – “are you on target”. That is my experience.
Michael replies: In my experience, that would be fine if “test cases” were meaningful ways to characterise testing work or if they were meaningful units of measurement. But in my experience, they are not. See “Test Cases Are Not Testing: Toward a Culture of Test Performance” by James Bach & Aaron Hodder (in http://www.testingcircus.com/documents/TestingTrapeze-2014-February.pdf#page=31), and The Case Against Test Cases
/Jesper
[…] A Tale of Four Projects Written by: Michael Bolton […]
[…] Blog: A Tale of Four Projects – Michael Bolton – http://www.developsense.com/blog/2014/04/a-tale-of-four-projects/ […]
I love this example. Thank you for this Michael.
[…] tight link between “testing progress” and test case execution. Michael Bolton has written quite eloquently on this issue recently and I can’t say it any better. (One of the participants in […]